


 New single-family home sales in September continued to be solid compared to recent numbers, but are still far off where some in the industry think they should be.
“If we look past the monthly volatility by using the 12-month rolling total of new home sales, September was the best month since August 2008,” said Trulia chief economist Ralph McLaughlin. “By historical standards, however, new home sales per household are still about 36 percent below the long-run average.”
According to the HUD and the U.S. Census Bureau, sales of new single-family houses in September were 593,000. This is up 3 percent from August, and 30 percent above September 2015. The median sales price of new houses sold in September was $313,500; the seasonally adjusted estimate of new houses for sale at the end of September was 235,000. This represents a supply of 4.8 months at the current sales rate.
“Some of the large year-over-year jump was due to a low bar set in September 2015,” McLaughlin said. Still, year-to-date new home sales also grew 13 percent year-over-year, which he said “reflects healthy demand for new homes by otherwise inventory-constrained homebuyers.”
“New homes comprised 11.8 percent of all home sales in September, increasing for the seventh straight month. As new construction continues its upward march, we should expect the share to increase accordingly. While new home sales represented about 11.8 percent of all sales, it’s still less than half of the pre-recession average of 23.6 percent. Clearly, there is still much potential for new housing to relieve inventory-constrained buyers.”
That said, McLaughlin is far from bullish on what September’s numbers mean overall. While September’s increase was statistically significant, he said, the range is wide.
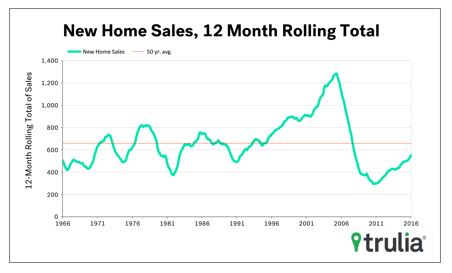 “The true number could be as low as 6.4 percent or as high as 53.2 percent,” he said. “A less volatile number to look at is the 12-month rolling total. The increase over last year puts the 12-month total at 84.1 percent of the 50-year average, up 0.7 percentage points from August.”
However, the 12-month rolling total of new home sales compared to the 50-year average looks a little worse when taking into account the size of the U.S. population. New home sales per 1,000 U.S. households was 4.7 in September, McLaughlin said. That’s 64.3 percent back to normal, though up from 63.4 percent last month.
If September didn’t look favorable to past peaks, it certainly looked encouraging. Sales in September increased for the seventh straight month, and new construction could keep things rolling.
“As new construction continues its upward march, we should expect the share to continue to increase accordingly,” McLaughlin said. “While new home sales represented about 11.8 percent of all sales, it’s still less than half of the pre-recession average of 23.6 percent. Clearly, there is still much potential for new housing to relieve inventory-constrained buyers.”
Click here to view the complete new home sales report for September from HUD and the Census Bureau.


